Master Your Sales Pipeline with This Visual Template
A Spreadsheet-Based Tool for Clear Sales Insights
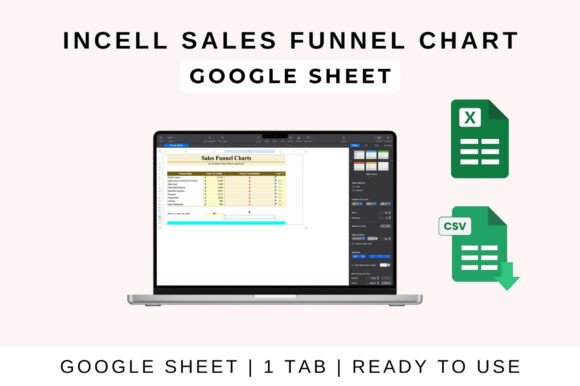
Forget complex external charting software or clunky diagrams. The In-Cell Sales Funnel Chart Template transforms your ordinary spreadsheet into a powerful, visual command center for your sales process. It’s a sleek, practical tool that uses the built-in formatting features of Google Sheets, Excel, or Numbers to create a dynamic funnel view right within your cells. This isn't just a static image; it's an interactive representation of your customer journey, from the first spark of awareness to the final conversion. For sales teams, marketers, and business analysts, it offers immediate clarity on where leads are coming from and where they might be dropping off.
The visual appeal is clean and professional. By leveraging in-cell bars, color scales, and conditional formatting, the template creates a horizontal or vertical funnel that’s easy to read at a glance. Each stage of your sales pipeline is represented by a row or column, with the width or color intensity visually indicating the volume of leads at that point. This approach eliminates the need to learn new software—you work directly in the spreadsheet environment you already know. The result is a living document that updates automatically as you input new data, making performance tracking and internal reporting straightforward and efficient.
Where This Template Truly Shines
The real power of the In-Cell Sales Funnel Chart Template lies in its versatility. It’s not just for quarterly reviews in a boardroom. Think about your weekly team stand-ups. Instead of sharing a static slide, you can present a live spreadsheet that everyone can view and even update collaboratively. For a small business owner, it’s perfect for tracking the effectiveness of a new marketing campaign, watching in real-time how social media ads translate into website visits, then leads, and finally sales. The template makes these connections visible.
It also excels in presentations and client reporting. When you need to show progress to stakeholders, a clear, data-driven funnel built within your familiar spreadsheet tool carries a sense of authenticity and transparency. There’s no smoke and mirrors—just your data visualized intelligently. For content creators and bloggers, you can adapt the concept to track audience engagement, from initial content views to newsletter sign-ups and product purchases. The flexibility to customize funnel stages means it can mold to any pipeline, whether you’re selling handmade crafts, consulting services, or digital products.
Practical Guidance for Implementation and Use
Getting started is designed to be simple. If you’re a Google Sheets user, you upload the template file to your Drive. The next step is the most crucial: entering your data. You’ll fill in metrics like the number of leads at each stage, perhaps labeled as Awareness, Interest, Consideration, and Conversion. The template’s formulas and conditional formatting rules do the heavy lifting, automatically calculating drop-off rates and adjusting the visual bars to reflect the numbers you input. This automation is where the template saves you countless hours of manual chart creation.
Customization is key to making it work for your specific needs. Don’t be afraid to adjust the categories to match your unique sales stages. You might have a "Proposal Sent" stage or a "Demo Completed" stage. The formulas can be tweaked to accommodate these changes. For those working in Microsoft Excel, the process is similarly smooth—download the file, enable editing, and start inputting your data. The template is fully compatible across platforms, ensuring consistency whether your team prefers Apple Numbers, Excel, or Sheets.
Consider the visual hierarchy it creates. Much like choosing a sans serif font for clean readability on a website, the funnel chart uses visual weight to guide the eye. The top of the funnel, with its larger volume, naturally draws attention first, while the narrowing bottom highlights conversion efficiency. This is modern typography principles applied to data visualization—using scale, color, and spacing to communicate priority and flow. When you share the sheet for collaboration, you’re not just sharing numbers; you’re sharing a story about your business’s performance that everyone can understand immediately.
Integrating This Tool into Your Workflow
To get the most out of the In-Cell Sales Funnel Chart Template, treat it as a central hub for sales discussion. Pair it with your other design assets and reporting tools. For instance, your brand identity might use a specific color palette; you can easily apply those exact hex codes to the funnel’s color scales to maintain visual consistency in all internal documents. This attention to detail reinforces professionalism, much like selecting a complementary font pairing for a brochure.
Think about its role in strategic planning. By analyzing the funnel over time, you can spot trends. Is there a consistent bottleneck at the "Interest" stage? Maybe your content needs to be more engaging. Is the drop-off from "Consideration" to "Conversion" too high? Perhaps your pricing or proposal process needs refinement. The template moves you from guessing to making data-informed decisions. It’s a practical application of modern typography thinking—where form follows function to serve a clear purpose: driving better business outcomes.
Ultimately, this template is about empowerment. It gives you the tools to build a clear, accurate, and visually compelling picture of your sales health without needing a degree in data science. It’s a testament to how powerful well-applied, simple design principles can be when solving everyday business challenges. By embedding the visualization directly where your data lives, it removes friction, encourages regular use, and helps keep your entire team aligned on the metrics that matter most.