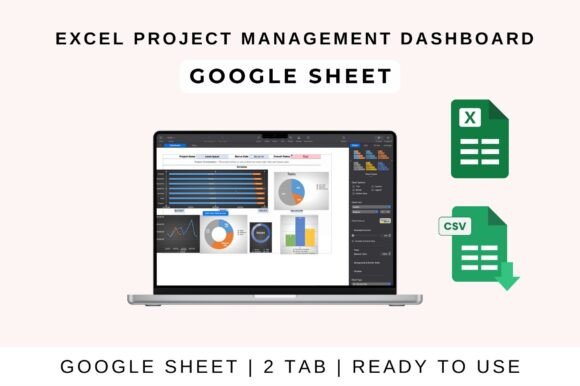
Excel Project Management Dashboard: Streamline Your Workflow
For designers, marketers, and small business owners, the chaos of managing multiple projects can be overwhelming. You are often juggling tight deadlines, shifting client priorities, and a team that needs clear direction. While there are many complex software solutions available, they can be expensive and require a steep learning curve. This is where a practical, built-in solution like the Excel Project Management Dashboard becomes an indispensable tool for maintaining control and clarity.
This all-in-one dashboard is designed to work within the applications you already use: Excel, Google Sheets, and Apple Numbers. It transforms a simple spreadsheet into a dynamic command center, allowing you to track project progress, assign responsibilities, and visualize status updates with professional, automated charts. It is a clean, professional, and highly functional design asset that brings order to your creative or business projects without the overhead of new software subscriptions.
A Visual Command Center for Clarity
The strength of this dashboard lies in its visual hierarchy and intuitive layout. It is not just a grid of data; it is a thoughtfully organized interface that uses modern typography and clear graphical elements to present information at a glance. The personality of the dashboard is one of efficiency and professionalism—calm, organized, and authoritative. It immediately establishes a sense of control, which is crucial for team morale and client confidence.
Key features include dedicated fields for task tracking with priority levels and owner assignments. A built-in Gantt chart provides a clear timeline visualization, turning complex schedules into an understandable sequence. Status reports are generated automatically through dynamic progress bars, and visual indicators for deadlines and delays ensure that potential problems are flagged early. The resource allocation summary helps you balance workloads effectively. Every element is designed to update automatically as you input data, saving you hours of manual chart creation.
Practical Applications Across Industries
The versatility of this Excel Project Management Dashboard makes it suitable for a wide range of projects. For a graphic designer managing a brand identity project, it can track deliverables like logo concepts, business card designs, and brand guideline documents. Each task can be assigned to a team member, with the Gantt chart showing the overlap between design, client review, and final production phases.
In marketing and content creation, the dashboard becomes a campaign hub. You can plan blog posts, social media graphics, email newsletters, and ad campaigns. The priority field helps you focus on high-impact activities, while the resource summary prevents any single team member from becoming overloaded. For publishers and bloggers, it can manage an editorial calendar, tracking articles from ideation and writing through editing, SEO optimization, and publication.
Small business owners and entrepreneurs will find it invaluable for product launches, website redesigns, or operational improvements. The ability to see project timelines and team responsibilities in one place facilitates better decision-making and communication. Even for personal projects or hobbyists undertaking large-scale crafts or events, the dashboard provides the structure needed to stay on track.
How to Implement and Customize Your Dashboard
Getting started is straightforward. For Google Sheets, simply upload the template to your Drive. Open it, and you can immediately begin entering your project data under the relevant categories. The sheet will auto-calculate totals, progress percentages, and generate the corresponding charts. You can then share the link with your team for real-time collaboration, allowing everyone to update their tasks and see the overall project status instantly.
In Microsoft Excel, download the file and open it on your desktop. If prompted, click "Enable Editing" to unlock full functionality. Input your project tasks, start and end dates, owners, and statuses. The dashboard's formulas and charts will automatically reflect these inputs. You can customize it further by adjusting categories, color schemes, or adding new fields to fit your specific workflow. The same process applies to Apple Numbers, ensuring compatibility across your preferred ecosystem.
When choosing to use a template like this, consider it a foundational font pairing for your project's operational side. Just as you would test a serif font with a sans serif font for a design project, you should evaluate how this dashboard fits your team's habits. Does the level of detail match your project complexity? Is the visual style appropriate for your internal team or client-facing reports? Most importantly, use it consistently. The real power of the Excel Project Management Dashboard is realized when it becomes the single source of truth for your projects, fostering accountability, improving readability of project status, and enhancing overall professionalism in your execution.